On this page
NOAA data is reliable within its intended scope
NOAA weather data is generally dependable when you use the right product for the right question. “NOAA weather data” is not one feed with a single accuracy score. It includes instrument observations, radar-derived estimates, model guidance, forecasts, warnings, and historical archives.
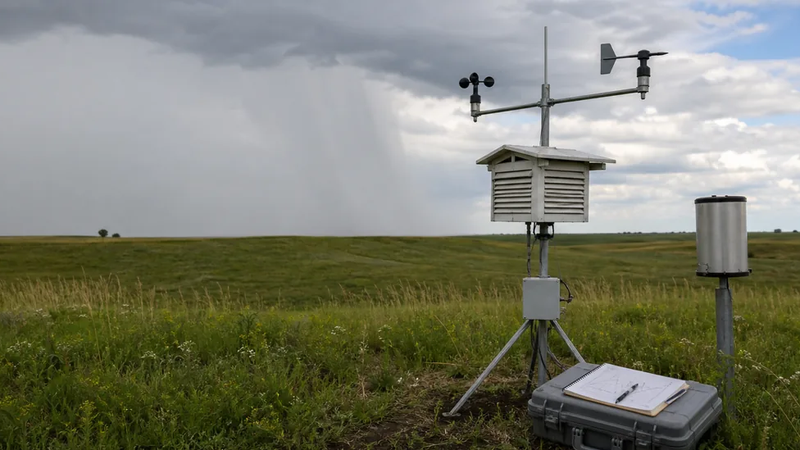
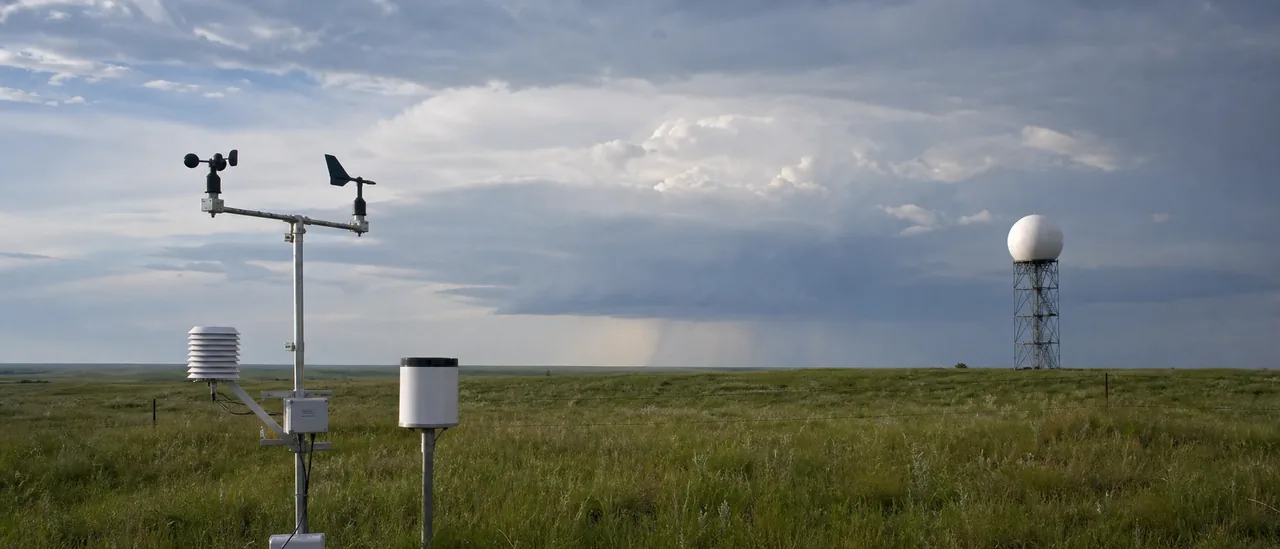
A quality-controlled station reading can describe conditions at that instrument, while a forecast expresses what may happen. Radar shows conditions sampled above the ground, not a measurement at every address.
Reliability depends on the product
| NOAA product | What it does well | Main limitation |
|---|---|---|
| Station observation | Measures conditions at a documented place and time | Conditions between stations may differ |
| Weather radar | Tracks precipitation and storm structure | Beam height, spreading, refraction, and distance affect sampling |
| Short-range forecast | Supports planning with observations and computer models | Uncertainty grows with lead time and local storm complexity |
| Historical archive | Supports climate and event research with documented datasets | Coverage, methods, and quality flags vary by dataset and era |
NOAA’s National Centers for Environmental Information applies automated quality checks to the Global Historical Climatology Network–Daily dataset. Those checks catch problems such as invalid dates, duplicate records, implausible extremes, and inconsistencies between nearby stations. Quality control reduces known errors; it does not create measurements where none were taken.
Forecast reliability also depends on timing. NOAA reports that a five-day forecast is accurate about 90% of the time and a seven-day forecast about 80%. The agency notes that estimates become less reliable farther into the future because weather models must approximate a continually changing atmosphere.
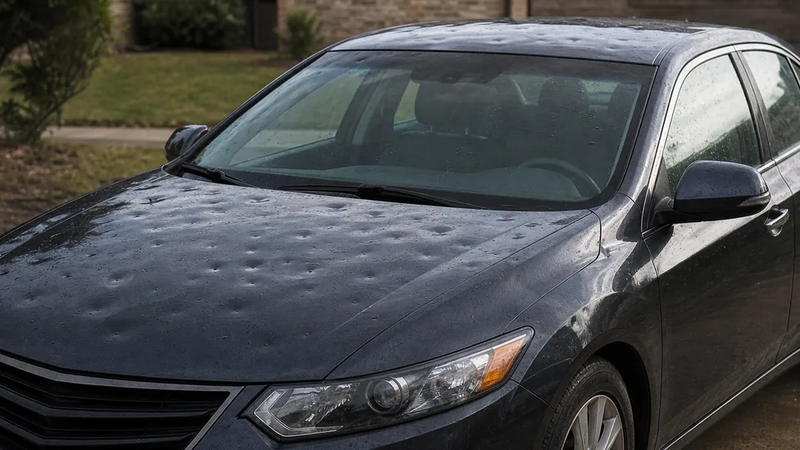
Those broad figures do not guarantee hail at one location. Small, fast-developing thunderstorms can be harder to resolve than a broad temperature pattern.
Radar detects storms, not property-level outcomes
Dual-polarization radar can help distinguish hail from rain and estimate hail size. However, the beam widens and samples higher parts of storms with distance. A radar-derived hail marker supports a weather analysis, but it does not prove what reached the ground at a specific point.
Use NOAA data with context
First identify whether you are viewing an observation, estimate, forecast, warning, or archive. Then check its timestamp, station or radar location, units, quality flags, and product notes. For forecasts, favor the newest issuance and expect confidence to decline with lead time.
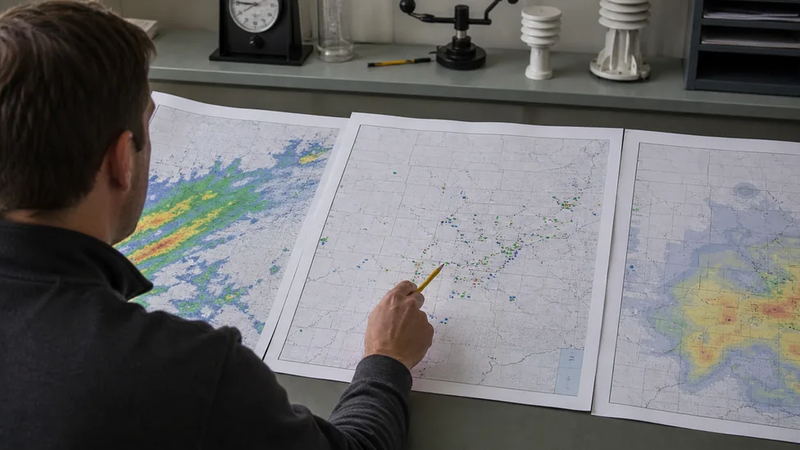
For historical questions, compare complementary evidence rather than treating one layer as definitive. Radar can show storm structure, station data can document nearby surface conditions, and reports can record observed weather. Agreement increases confidence, but gaps or disagreement should remain visible in the conclusion.
The practical bottom line is simple: NOAA data is authoritative and highly useful, but reliability is product-specific. Use it as measured evidence or a qualified estimate—not as certainty beyond the resolution, time, and purpose of the dataset.