On this page
The clearest answer
El Paso County, Colorado, ranks first by mapped hail-report count in NOAA's current National Hail Archive. Grouping the archive's 1955–2025 points by county returns 1,884 reports for El Paso County and 1,578 for Pennington County, South Dakota.
That answer uses one specific metric: mapped reports. It does not count the unknowable total number of hailstones, hailstorms, or hail days.
Why El Paso County ranks first
The Storm Prediction Center compiles hail reports from National Weather Service Storm Data. Its current dashboard covers hail reports from 1955 through 2025, so this ranking can be checked against a defined period and dataset.
A single storm can produce reports from several places or times. Consequently, 1,884 mapped points do not mean 1,884 separate storms.
Population density and road networks can leave some areas under-reported, according to an NWS hail climatology. The ranking therefore describes documented report points, not each county's complete hail history.
Hail forms in thunderstorm updrafts, and stronger updrafts can support larger stones. That physical process makes hail size meaningful, but it does not remove the observation bias in county report totals.
The comparison also spans a changing definition. The National Weather Service raised its severe-hail threshold from 0.75 inch to 1 inch in 2010, although SPC continues including 0.75-inch reports for legacy use.
“Most hail” depends on the metric
El Paso County leads this mapped-report count. A ranking by hail days, reports per square mile, radar-estimated swaths, stone size, or a shorter period could produce a different order.
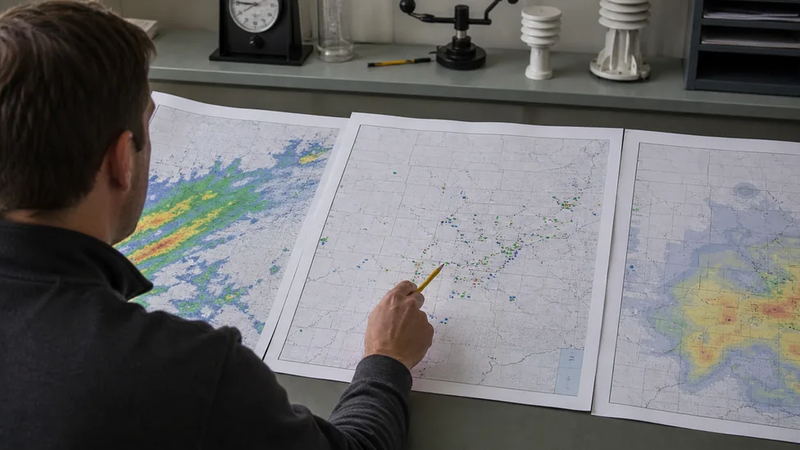
Reports, radar, and damage are different records
These terms answer different questions:
| Record | What it shows | What it does not establish |
|---|---|---|
| Ground hail report | Hail documented at a stated place and time | Every location reached by the storm |
| Radar hail estimate | Probable hail conditions inferred from radar | Confirmed hail at the surface |
| Damage record | Reported or estimated property or crop loss | That all hail reports caused damage |
NOAA cautions that much automatically derived radar data represents probable conditions rather than confirmed occurrence. Likewise, the Storm Events format stores hail magnitude and estimated property damage in separate fields. A hail report—or a radar-colored map—therefore cannot confirm damage to a particular property.
Practical bottom line
El Paso County, Colorado, is the clearest answer when “most” means mapped NOAA hail reports from 1955 through 2025. It is not a universal measure of hail frequency or severity. New data can change the totals, while another carefully defined metric may name a different county.